A
B
C
D
Text Solution
Verified by Experts
The correct Answer is:


Topper's Solved these Questions
Similar Questions
Explore conceptually related problems
KIRAN PUBLICATION-STATISTICS AND DATA INTERPRETATION-TYPE-VII
- Study the pie-chart and table given below and answer the questions. ...
Text Solution
|
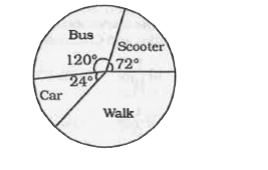
- The following graph represents the transport used by children. Study t...
Text Solution
|
- The following graph represents the transport used by children. Study t...
Text Solution
|
- The following graph represents the transport used by children. Study t...
Text Solution
|
- The following graph represents the transport used by children. Study t...
Text Solution
|
- In an Institution there are 800 students. Students use different modes...
Text Solution
|
- In an Institution there are 800 students. Students use different modes...
Text Solution
|
- In an Institution there are 800 students. Students use different modes...
Text Solution
|
- The expenses of a country for a particular year is given in Pie-Chart....
Text Solution
|
- The expenses of a country for a particular year is given in Pie-Chart....
Text Solution
|
- The expenses of a country for a particular year is given in Pie-Chart....
Text Solution
|
- The expenses of a country for a particular year is given in Pie-Chart....
Text Solution
|
- The expenses of a country for a particular year is given in Pie-Chart....
Text Solution
|
- Study the following graph carefully and answer the given questions. ...
Text Solution
|
- Study the following graph carefully and answer the given questions. ...
Text Solution
|
- Study the following graph carefully and answer the given questions. ...
Text Solution
|
- Study the following graph carefully and answer the given questions. ...
Text Solution
|
- Study the following graph carefully and answer the given questions. ...
Text Solution
|
- The following ple-chart shows the sources of funds (In Rs. crores) to ...
Text Solution
|
- The following ple-chart shows the sources of funds (In Rs. crores) to ...
Text Solution
|