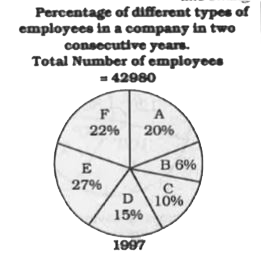
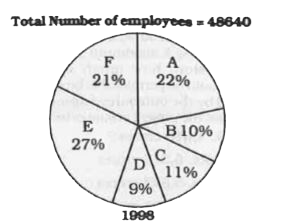
A
B
C
D
Text Solution
Verified by Experts
The correct Answer is:


Topper's Solved these Questions
Similar Questions
Explore conceptually related problems
KIRAN PUBLICATION-STATISTICS AND DATA INTERPRETATION-TYPE-VII
- Study the following graph carefully and answer the given questions. ...
Text Solution
|
- Study the following graph carefully and answer the given questions. ...
Text Solution
|
- Study the following graph carefully and answer the given questions. ...
Text Solution
|
- Study the following graph carefully and answer the given questions. ...
Text Solution
|
- Study the following graph carefully and answer the given questions. ...
Text Solution
|
- The following ple-chart shows the sources of funds (In Rs. crores) to ...
Text Solution
|
- The following ple-chart shows the sources of funds (In Rs. crores) to ...
Text Solution
|
- The following ple-chart shows the sources of funds (In Rs. crores) to ...
Text Solution
|
- The income of a state under different heads is given in the following ...
Text Solution
|
- The income of a state under different heads is given in the following ...
Text Solution
|
- The income of a state under different heads is given in the following ...
Text Solution
|
- The pie-chart shows the proposed outlay fdor different sectors during ...
Text Solution
|
- The pie-chart shows the proposed outlay fdor different sectors during ...
Text Solution
|
- The pie-chart shows the proposed outlay fdor different sectors during ...
Text Solution
|
- The following pie-chart shows the market share of four companies S, T,...
Text Solution
|
- The following pie-chart shows the market share of four companies S, T,...
Text Solution
|
- The pie chart shyows how the school funds is spent under different hea...
Text Solution
|
- The pie chart shyows how the school funds is spent under different hea...
Text Solution
|
- The pie chart shyows how the school funds is spent under different hea...
Text Solution
|
- The pie chart shyows how the school funds is spent under different hea...
Text Solution
|