A
B
C
D
Text Solution
Verified by Experts
The correct Answer is:


Topper's Solved these Questions
Similar Questions
Explore conceptually related problems
KIRAN PUBLICATION-STATISTICS AND DATA INTERPRETATION-TYPE-VII
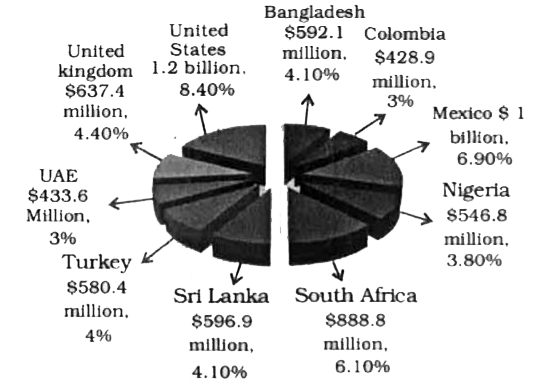
- The following pie chart shows th export of automobiles of India to the...
Text Solution
|
- The following pie chart shows th export of automobiles of India to the...
Text Solution
|
- The following pie chart shows th export of automobiles of India to the...
Text Solution
|
- The following pie chart shows th export of automobiles of India to the...
Text Solution
|
- The following pie chart shows th export of automobiles of India to the...
Text Solution
|
- The following pie-chart shows the study-time of different subjects of ...
Text Solution
|
- The following pie-chart shows the study-time of different subjects of ...
Text Solution
|
- The following pie-chart shows the study-time of different subjects of ...
Text Solution
|
- The following pie-chart shows the study-time of different subjects of ...
Text Solution
|
- The pie-chart shows the percentage of literate and illiterate males an...
Text Solution
|
- The pie-chart shoews the percentage of literate and illiterate males a...
Text Solution
|
- The pie-chart shows the percentage of literate and illiterate males an...
Text Solution
|
- The pie-chart shoews the percentage of literate and illiterate males a...
Text Solution
|
- Study the following pie chart carefully and answer the questions. The ...
Text Solution
|
- Study the following pie chart carefully and answer the questions. The ...
Text Solution
|
- Study the following pie chart carefully and answer the questions. The ...
Text Solution
|
- Study the following pie chart carefully and answer the questions. The ...
Text Solution
|
- Given here is a pie chart showing the cost of gold in 2010, 2011, 2012...
Text Solution
|
- Given here is a pie chart showing the cost of gold in 2010, 2011, 2012...
Text Solution
|
- Given here is a pie chart showing the cost of gold in 2010, 2011, 2012...
Text Solution
|