A
B
C
D
Text Solution
Verified by Experts
The correct Answer is:


Topper's Solved these Questions
Similar Questions
Explore conceptually related problems
KIRAN PUBLICATION-STATISTICS AND DATA INTERPRETATION-TYPE-VII
- The pie chart shows the contribution of all the sectors towards the GD...
Text Solution
|
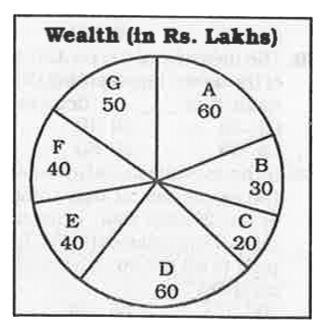
- The pie chart shows the distribution of wealth among 7 children accord...
Text Solution
|
- The pie chart shows the distribution of wealth among 7 children accord...
Text Solution
|
- The pie chart shows the distribution of wealth among 7 children accord...
Text Solution
|
- The pie chart shows the distribution of wealth among 7 children accord...
Text Solution
|
- The HR department of a company prepared a report. The pie chart from t...
Text Solution
|
- The HR department of a company prepared a report. The pie chart from t...
Text Solution
|
- The HR department of a company prepared a report. The pie chart from t...
Text Solution
|
- The HR department of a company prepared a report. The pie chart from t...
Text Solution
|
- The pie chart shows the number of tigers in all the tiger wild life sa...
Text Solution
|
- The pie chart shows the number of tigers in all the tiger wild life sa...
Text Solution
|
- The pie chart shows the number of tigers in all the tiger wild life sa...
Text Solution
|
- The pie chart shows the number of tigers in all the tiger wild life sa...
Text Solution
|
- The HR department of a company prepared a report. The pie chart repres...
Text Solution
|
- The HR department of a company prepared a report. The pie chart repres...
Text Solution
|
- The HR department of a company prepared a report. The pie chart repres...
Text Solution
|
- The HR department of a company prepared a report. The pie chart repres...
Text Solution
|
- The pie chart shows the results of an online survey which asked people...
Text Solution
|
- The pie chart shows the results of an online survey which asked people...
Text Solution
|
- The pie chart shows the results of an online survey which asked people...
Text Solution
|