


Topper's Solved these Questions
Similar Questions
Explore conceptually related problems
MODERN PUBLICATION-PHOTOSYNTHESIS IN HIGHER PLANTS-EXAMPLE
- By looking at a plant externally can you tell whether a plant is C3 or...
Text Solution
|
- By looking at which internal structure of a plant can you tell whether...
Text Solution
|
- Even though a very few cells in a C4 plant carry out the biosynthetic ...
Text Solution
|
- RuBisCO is an enzyme that acts both as a carboxylase and oxygenase. Wh...
Text Solution
|
- Suppose there were plants that had a high concentration of Chlorophyll...
Text Solution
|
- Why is the colour of a leaf kept in the dark frequently yellow, or pal...
Text Solution
|
- Look at leaves of the same plant on the shady side and compare it with...
Text Solution
|
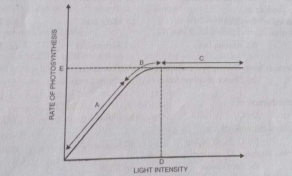
- Figure given below shows the effect of light on the rate of photosynth...
Text Solution
|
- Figure given below shows the effect of light on the rate of photosynth...
Text Solution
|
- Figure given below shows the effect of light on the rate of photosynth...
Text Solution
|
- Give comparison between the following: C3 and C4 pathways
Text Solution
|
- Give comparison between the following: Cyclic and non-cyclic photopho...
Text Solution
|
- Give comparison between the following: Anatomy of leaf in C3 and C4 p...
Text Solution
|