


Topper's Solved these Questions
DATA HANDLING
NAND LAL PUBLICATION|Exercise EXERCISE-5.1 |2 VideosDATA HANDLING
NAND LAL PUBLICATION|Exercise EXERCISE-5.2|5 VideosDATA HANDLING
NAND LAL PUBLICATION|Exercise Think, Discuss and Write |2 VideosCUBES AND CUBE ROOTS
NAND LAL PUBLICATION|Exercise Sample Paper For Practice |18 VideosDIRECT AND INVERSE PROPORTIONS
NAND LAL PUBLICATION|Exercise SAMPLE PAPER FOR PRACTICE ( Fill in the blanks ) |17 Videos
Similar Questions
Explore conceptually related problems
NAND LAL PUBLICATION-DATA HANDLING -Try these
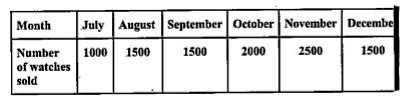
- Draw an appropriate graph to represent the given information.
Text Solution
|
- Draw an appropriate graph to represent the given information.
Text Solution
|
- A group of students were asked to say which animal they would like mos...
Text Solution
|
- Study the following Frequency distribution table and answer the questi...
Text Solution
|
- Construct a frequency distribution table for the data on weights ( in...
Text Solution
|
- The following graph is another historam (Fig.) From the bars of t...
Text Solution
|
- Observe the histogram (fig.) and answer the question given below: ...
Text Solution
|
- Which two ttypes of programmes have number of viewers equal to those w...
Text Solution
|
- Draw a pie chart of the data given below: The time spent by a child du...
Text Solution
|
- If you try to start a scooter,what are the possible outcomes ?
Text Solution
|
- When a die is thrown, what are the six possible outcomes?
Text Solution
|
- When you spin the wheel shown, what are the possible outcomes (see adj...
Text Solution
|
- You have a bag with five identical balls of different colours and you ...
Text Solution
|
- Suppose you spin the wheel (i) List the number of outcomes of getti...
Text Solution
|