


Topper's Solved these Questions
DATA HANDLING
NAND LAL PUBLICATION|Exercise EXERCISE-5.3|6 VideosDATA HANDLING
NAND LAL PUBLICATION|Exercise ADDITIONAL QUESTIONS FOR PRACTICE (Objective Type Questions)|21 VideosDATA HANDLING
NAND LAL PUBLICATION|Exercise EXERCISE-5.1 |2 VideosCUBES AND CUBE ROOTS
NAND LAL PUBLICATION|Exercise Sample Paper For Practice |18 VideosDIRECT AND INVERSE PROPORTIONS
NAND LAL PUBLICATION|Exercise SAMPLE PAPER FOR PRACTICE ( Fill in the blanks ) |17 Videos
Similar Questions
Explore conceptually related problems
NAND LAL PUBLICATION-DATA HANDLING -EXERCISE-5.2
- A survey was made to find the type of music that a certain group of yo...
Text Solution
|
- A group of 360 people were asked to vote for their favorite season fro...
Text Solution
|
- Draw the pie clart showing the following information. The table shows ...
Text Solution
|
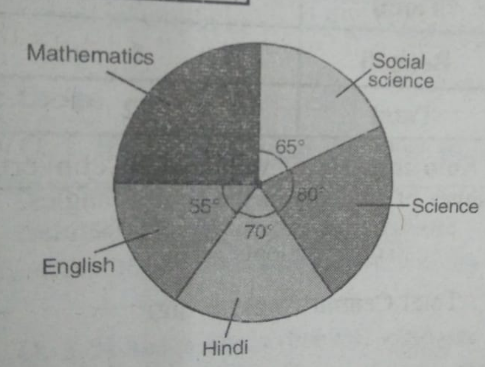
- The adjoining pie chart gives the marks scored in an examination by a ...
Text Solution
|
- The number of students in a hostel,speaking different languages is giv...
Text Solution
|