


Topper's Solved these Questions
DATA HANDLING
NAND LAL PUBLICATION|Exercise SAMPLE PAPER FOR PRACTICE (Answer the multiple choice question)|4 VideosDATA HANDLING
NAND LAL PUBLICATION|Exercise SAMPLE PAPER FOR PRACTICE (Fill in the blanks)|4 VideosDATA HANDLING
NAND LAL PUBLICATION|Exercise ADDITIONAL QUESTIONS FOR PRACTICE (Short Answer Type Questions)|2 VideosCUBES AND CUBE ROOTS
NAND LAL PUBLICATION|Exercise Sample Paper For Practice |18 VideosDIRECT AND INVERSE PROPORTIONS
NAND LAL PUBLICATION|Exercise SAMPLE PAPER FOR PRACTICE ( Fill in the blanks ) |17 Videos
Similar Questions
Explore conceptually related problems
NAND LAL PUBLICATION-DATA HANDLING -ADDITIONAL QUESTIONS FOR PRACTICE (Long Answer Type Questions)
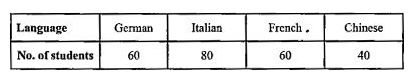
- Draw a pie chart for the following data. Number of students studying l...
Text Solution
|
- The ages of 30 teachers in a school are as follows: 25, 28, 43, 36,...
Text Solution
|
- When two coins are tossed simultaneously. Find the probability of gett...
Text Solution
|
- When two coins are tossed simultaneously. Find the probability of gett...
Text Solution
|
- When two coins are tossed simultaneously. Find the probability of gett...
Text Solution
|
- When two coins are tossed simultaneously. Find the probability of gett...
Text Solution
|
- A card is drawn at random from a pack of 52 cards. Put the probability...
Text Solution
|
- A card is drawn at random from a pack of 52 cards. Put the probability...
Text Solution
|
- A card is drawn at random from a pack of 52 cards. Put the probability...
Text Solution
|
- A card is drawn at random from a pack of 52 cards. Put the probability...
Text Solution
|
- A packet contains 6 red balloons, 5 blue balloons and 4 white balloons...
Text Solution
|
- A packet contains 6 red balloons, 5 blue balloons and 4 white balloons...
Text Solution
|
- A packet contains 6 red balloons, 5 blue balloons and 4 white balloons...
Text Solution
|
- A packet contains 6 red balloons, 5 blue balloons and 4 white balloons...
Text Solution
|