


Topper's Solved these Questions
DATA HANDLING
NAND LAL PUBLICATION|Exercise SAMPLE PAPER FOR PRACTICE (Fill in the blanks)|4 VideosCUBES AND CUBE ROOTS
NAND LAL PUBLICATION|Exercise Sample Paper For Practice |18 VideosDIRECT AND INVERSE PROPORTIONS
NAND LAL PUBLICATION|Exercise SAMPLE PAPER FOR PRACTICE ( Fill in the blanks ) |17 Videos
Similar Questions
Explore conceptually related problems
NAND LAL PUBLICATION-DATA HANDLING -SAMPLE PAPER FOR PRACTICE
- Correct the following statement. In the experiment of tossing a co...
Text Solution
|
- Correct the following statement. Central angle of a sector in a pie...
Text Solution
|
- Correct the following statement. A graph showing two sets of data si...
Text Solution
|
- Correct the following statement. In the class interval 0–40, 40-80....
Text Solution
|
- The pie chart given below gives the expenses in % on various items alo...
Text Solution
|
- The average temperatures (""^(@)C) of a city for the particular month ...
Text Solution
|
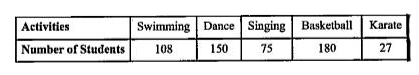
- The following table shows the number of students in various classes in...
Text Solution
|
- List the possible out comes when three coins are tossed simultaneously...
Text Solution
|
- A card is drawn from a well shuffled pack of 52 playing cards. What is...
Text Solution
|
- A letter is chosen from a word MATHEMATICS. What is the probability th...
Text Solution
|