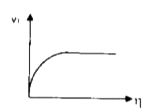
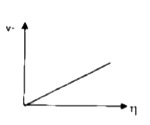
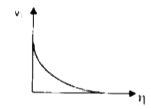
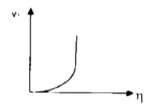
Home
Class 12
PHYSICS
Which of the following diagram correctl...

Which of the following diagram correctly shows the relation between the terminal velocity `V_(T)` of a spherical body falling in a liquid and viscosity `eta` of the liquid ?

A

B

C

D

Text Solution

Verified by Experts

Promotional Banner

Topper's Solved these Questions

  • QUESTION PAPER 2020

    WB JEE PREVIOUS YEAR PAPER|Exercise PHYSICS (CATEGORY-II)|1 Videos
  • QUESTION PAPER 2020

    WB JEE PREVIOUS YEAR PAPER|Exercise PHYSICS (CATEGORY-III)|3 Videos
  • QUESTION PAPER 2007

    WB JEE PREVIOUS YEAR PAPER|Exercise PHYSICS|50 Videos

Similar Questions

Explore conceptually related problems

Which of the following correctly represents the relation between capillary rise (h) and radius of capillary (r)-

How is the terminal velocity of a body related with the coefficient of viscosity of a viscous medium?

A body is thrown vertically upwards. Which one of the following graphs correctly represent the velocity vs time?

Show how density of a liquid varies with temperature. Or, Establish the relation between the density of al liquid and the coefficient of its real expansion.