Text Solution
Verified by Experts


Topper's Solved these Questions
COAL AND PETROLEUM
MTG IIT JEE FOUNDATION|Exercise EXERCISE (MULTIPLE CHOICE QUESTION) LEVEL 1 |30 VideosCOAL AND PETROLEUM
MTG IIT JEE FOUNDATION|Exercise EXERCISE (MULTIPLE CHOICE QUESTION) LEVEL 2|20 VideosCOAL AND PETROLEUM
MTG IIT JEE FOUNDATION|Exercise SOLVED EXAMPLES |16 VideosATOMS, MOLECULES AND ATOMIC STRUCTURE
MTG IIT JEE FOUNDATION|Exercise EXERCISE ( Integer/Numerical Value Type)|5 VideosCOMBUSTION AND FLAME
MTG IIT JEE FOUNDATION|Exercise OLYMPIAD/HOTS CORNER |15 Videos
Similar Questions
Explore conceptually related problems
MTG IIT JEE FOUNDATION-COAL AND PETROLEUM-NCERT SECTION
- What are the advantages of using CNG and LPG as fuels?
Text Solution
|
- Name the petroleum product used for surfacing of roads.
Text Solution
|
- Describe how coal is formed from dead vegetation. What is this process...
Text Solution
|
- Fossil fuels are ......................... and .............
Text Solution
|
- Process of separation of different constituents from petroleum is call...
Text Solution
|
- Tick true/false against the following statements. Coke is almost pur...
Text Solution
|
- Tick true/false against the following statements. Kerosene is not a ...
Text Solution
|
- Explain why fossil fuels are exhaustible natural resources.
Text Solution
|
- Describe characteristics and uses of coke.
Text Solution
|
- Explain the process of formation of petroleum
Text Solution
|
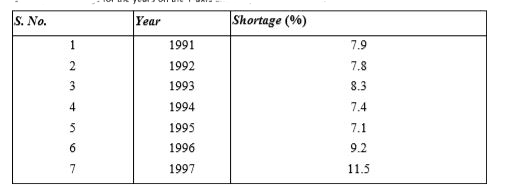
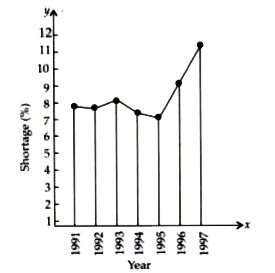
- The following Table shows the total power shortage in India from 1991 ...
Text Solution
|