A
B
C
D
Text Solution
Verified by Experts
The correct Answer is:


Topper's Solved these Questions
PROBABILITY
MTG IIT JEE FOUNDATION|Exercise EXERCISE (MATCH THE FOLLOWING)|1 VideosPROBABILITY
MTG IIT JEE FOUNDATION|Exercise EXERCISE (ASSERTION AND REASON TYPE)|5 VideosPROBABILITY
MTG IIT JEE FOUNDATION|Exercise NCERT SECTION (EXERCISE 15.1)|20 VideosPOLYNOMIALS
MTG IIT JEE FOUNDATION|Exercise Olympiad/HOTS Corner|20 VideosQUADRILATERALS
MTG IIT JEE FOUNDATION|Exercise Olympiad/HOTS CORNER|15 Videos
Similar Questions
Explore conceptually related problems
MTG IIT JEE FOUNDATION-PROBABILITY-EXERCISE (MULTIPLE CHOICE QUESTIONS)
- A group of 80 students of Class IX are selected and asked for their ch...
Text Solution
|
- A and Bare the only two outcomes of an event. If P(A) = 0.72, then wha...
Text Solution
|
- A coin is tossed for a certain number of times. If the probability of ...
Text Solution
|
- An English book contains 130 pages. A page is selected at random. What...
Text Solution
|
- If three dice are thrown simultaneously, then the probability of getti...
Text Solution
|
- The probabilities of the following frequencies of an experiment is giv...
Text Solution
|
- If 10/100, 13/100 , 15/100, 18/100, x/100, 30/100are the probabilitie...
Text Solution
|
- Two coins are tossed, then find the values of x, y and z in the follow...
Text Solution
|
- Cards marked with the numbers 2 to 101 are placed in a box and mixed t...
Text Solution
|
- In a school, 100 students took part in Van Mahotsava and helped each o...
Text Solution
|
- In a kitchen, there are 108 utensils, consisting of bowls, plates and ...
Text Solution
|
- If the probability of winning a race of an athlete is 1/6 less than th...
Text Solution
|
- In a survey, out of all students, 53% said 'No 20% said 'Yes' and the ...
Text Solution
|
- Two sections of class IX having 27 students in each section appeared f...
Text Solution
|
- Two sections of class IX having 27 students in each section appeared f...
Text Solution
|
- 100 plants each were sown in six different colonies A, B, C, D, E and ...
Text Solution
|
- 100 plants each were sown in six different colonies A, B, C, 0, E and ...
Text Solution
|
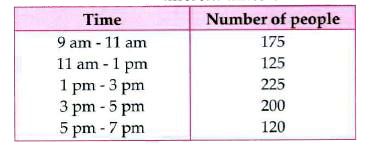
- The table shows the number of people visiting the 'Good-Living pavilio...
Text Solution
|
- The table shows the number of people visiting the 'Good-Living pavilio...
Text Solution
|
- A bag contains 20 balls out of which x are white. If 10 more white bal...
Text Solution
|