


Topper's Solved these Questions
DATA HANDLING
MTG IIT JEE FOUNDATION|Exercise Solved Examples|37 VideosDATA HANDLING
MTG IIT JEE FOUNDATION|Exercise NCERT Section (Exercise 9.1)|22 VideosBASIC GEOMETRICAL IDEAS
MTG IIT JEE FOUNDATION|Exercise OLYMPIAD/HOTS CORNER|10 VideosDECIMALS
MTG IIT JEE FOUNDATION|Exercise OLYMPIAD/HOTS CORNER|20 Videos
Similar Questions
Explore conceptually related problems
MTG IIT JEE FOUNDATION-DATA HANDLING -Olympiad/HOTS Corner
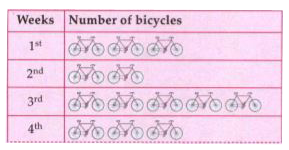
- The pictograph shows the number of bicycles made by a factory during t...
Text Solution
|
- Study the bar graph given below and answer the following questions. ...
Text Solution
|
- Study the bar graph given below and answer the following questions. ...
Text Solution
|
- Study the given graph carefully and answer the following questions. ...
Text Solution
|
- Study the given graph carefully and answer the following questions. ...
Text Solution
|
- The given bar graph shows number of cars washed by five friends to rai...
Text Solution
|
- The given table shows the number of chapatis Ms sharma made on each da...
Text Solution
|
- The given table shows the number of chapatis Ms sharma made on each da...
Text Solution
|
- The given bar graph shows the sale of different brands of shirts in a ...
Text Solution
|
- The total number of students who applied for scholarship in the last f...
Text Solution
|
- The given graph shows the sale of story books in a bookshop for the fi...
Text Solution
|