


Topper's Solved these Questions
DATA HANDLING
MTG IIT JEE FOUNDATION|Exercise Exercise (Multiple Choice Questions) Level -1|35 VideosDATA HANDLING
MTG IIT JEE FOUNDATION|Exercise Exercise (Multiple Choice Questions) Level -2|16 VideosDATA HANDLING
MTG IIT JEE FOUNDATION|Exercise NCERT Section (Exercise 9.3)|11 VideosBASIC GEOMETRICAL IDEAS
MTG IIT JEE FOUNDATION|Exercise OLYMPIAD/HOTS CORNER|10 VideosDECIMALS
MTG IIT JEE FOUNDATION|Exercise OLYMPIAD/HOTS CORNER|20 Videos
Similar Questions
Explore conceptually related problems
MTG IIT JEE FOUNDATION-DATA HANDLING -NCERT Section (Exercise 9.4)
- A survey of 120 school students was done to find which activity they p...
Text Solution
|
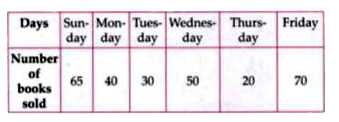
- The number of Mathematics books sold by a shopkeeper on six consecutiv...
Text Solution
|
- Following table shows the number of bicycles manufactured in a factory...
Text Solution
|
- Following table shows the number of bicycles manufactured in a factory...
Text Solution
|