A
B
C
D
Text Solution
Verified by Experts
The correct Answer is:


Topper's Solved these Questions
DATA HANDLING
MTG IIT JEE FOUNDATION|Exercise Exercise (Multiple Choice Questions) Level -2|16 VideosDATA HANDLING
MTG IIT JEE FOUNDATION|Exercise Exercise (Match the following) |2 VideosDATA HANDLING
MTG IIT JEE FOUNDATION|Exercise NCERT Section (Exercise 9.4)|4 VideosBASIC GEOMETRICAL IDEAS
MTG IIT JEE FOUNDATION|Exercise OLYMPIAD/HOTS CORNER|10 VideosDECIMALS
MTG IIT JEE FOUNDATION|Exercise OLYMPIAD/HOTS CORNER|20 Videos
Similar Questions
Explore conceptually related problems
MTG IIT JEE FOUNDATION-DATA HANDLING -Exercise (Multiple Choice Questions) Level -1
- The given pictograph shows the number of girls in class X-XII. T...
Text Solution
|
- The given bar graph shows the number of cars sold from Jan to Dec. ...
Text Solution
|
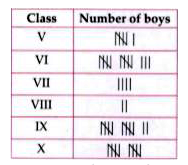
- The given data shows the number of boys in classes V to X of a school....
Text Solution
|
- The presentation of data in the form of pictures is called .
Text Solution
|
- The number of times an observation is repeated in a data is called .
Text Solution
|
- The bar graph shows the temperatures in 6 cities. The difference ...
Text Solution
|
- The bar graph shows the temperatures in 6 cities. The number of c...
Text Solution
|
- The bar graph shows the temperatures in 6 cities. If a place with...
Text Solution
|
- Production of cars in a factory in different years is shown below. ...
Text Solution
|
- The following table shows the number of chocolates four friends have. ...
Text Solution
|
- Using tally marks, which one of the following represents the number ei...
Text Solution
|
- Following information shows different type of soap used by children. ...
Text Solution
|
- The two bars of the same value are .
Text Solution
|
- Record of the numbers shown on the top face of a die, rolled 20 times,...
Text Solution
|
- The given bar graph, shows the number of students in different classes...
Text Solution
|
- The given bar graph, shows the number of students in different classes...
Text Solution
|
- The given bar graph, shows the number of students in different classes...
Text Solution
|
- If one represents 35 pens, then will represent
Text Solution
|
- The bar-graph given below shows the runs scored in six overs by a bats...
Text Solution
|
- The bar-graph given below shows the runs scored in six overs by a bats...
Text Solution
|