A
B
C
D
Text Solution
Verified by Experts
The correct Answer is:


Topper's Solved these Questions
DATA HANDLING
MTG IIT JEE FOUNDATION|Exercise Exercise (Match the following) |2 VideosDATA HANDLING
MTG IIT JEE FOUNDATION|Exercise Exercise (Assertion & Reason Type )|5 VideosDATA HANDLING
MTG IIT JEE FOUNDATION|Exercise Exercise (Multiple Choice Questions) Level -1|35 VideosBASIC GEOMETRICAL IDEAS
MTG IIT JEE FOUNDATION|Exercise OLYMPIAD/HOTS CORNER|10 VideosDECIMALS
MTG IIT JEE FOUNDATION|Exercise OLYMPIAD/HOTS CORNER|20 Videos
Similar Questions
Explore conceptually related problems
MTG IIT JEE FOUNDATION-DATA HANDLING -Exercise (Multiple Choice Questions) Level -2
- The given pictograph shows the number of pizzas delivered by pizza hut...
Text Solution
|
- The given pictograph shows the number of pizzas delivered by pizza hut...
Text Solution
|
- The given pictograph shows the number of animals in 5 different zoos. ...
Text Solution
|
- On the scale, 1 unit length = 10 crore, the bar of length 6 units will...
Text Solution
|
- The following pictograph shows favourite ice cream flavours of boys in...
Text Solution
|
- The following pictograph shows favourite ice cream flavours of boys in...
Text Solution
|
- Read the bar graph given below and answer the following questions. ...
Text Solution
|
- Read the bar graph given below and answer the following questions. ...
Text Solution
|
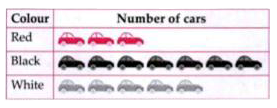
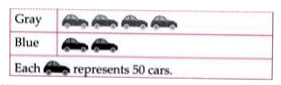
- The following pictograph shows the sale of cars of different colours i...
Text Solution
|
- The following pictograph shows the sale of cars of different colours i...
Text Solution
|
- Look at the bar graph and answer the following questions. In whi...
Text Solution
|
- Look at the bar graph and answer the following questions. How man...
Text Solution
|
- Observe the bar graph and answer the following questions. Which ...
Text Solution
|
- Observe the bar graph and answer the following questions. What ...
Text Solution
|
- Observe the following pictograph and answer the following questions. ...
Text Solution
|
- Observe the following pictograph and answer the following questions. ...
Text Solution
|