A
B
C
D
Text Solution
Verified by Experts
The correct Answer is:


Topper's Solved these Questions
DATA HANDLING
MTG IIT JEE FOUNDATION|Exercise Exercise (Comprehension Type )|6 VideosDATA HANDLING
MTG IIT JEE FOUNDATION|Exercise Exercise (Subjective Problems (Very Short Answer Type))|9 VideosDATA HANDLING
MTG IIT JEE FOUNDATION|Exercise Exercise (Match the following) |2 VideosBASIC GEOMETRICAL IDEAS
MTG IIT JEE FOUNDATION|Exercise OLYMPIAD/HOTS CORNER|10 VideosDECIMALS
MTG IIT JEE FOUNDATION|Exercise OLYMPIAD/HOTS CORNER|20 Videos
Similar Questions
Explore conceptually related problems
MTG IIT JEE FOUNDATION-DATA HANDLING -Exercise (Assertion & Reason Type )
- Assertion : Consider the marks scored by 10 students in a test. 10, 9,...
Text Solution
|
- Assertion : Raw data should be arranged in tabular form for its repres...
Text Solution
|
- The number of two-wheelers owned by each of 45 families are listed bel...
Text Solution
|
- The pictograph shows the number of computers sold by a company during ...
Text Solution
|
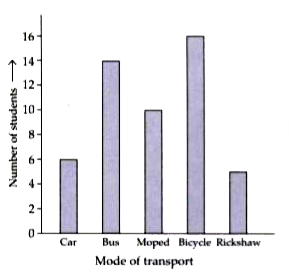
- 51 students from a locality use different modes of transport to go to ...
Text Solution
|