Text Solution
Verified by Experts
The correct Answer is:


Topper's Solved these Questions
DATA HANDLING
MTG IIT JEE FOUNDATION|Exercise Exercise (Subjective Problems (Short Answer Type))|12 VideosDATA HANDLING
MTG IIT JEE FOUNDATION|Exercise Exercise (Subjective Problems (Long Answer Type)|10 VideosDATA HANDLING
MTG IIT JEE FOUNDATION|Exercise Exercise (Comprehension Type )|6 VideosBASIC GEOMETRICAL IDEAS
MTG IIT JEE FOUNDATION|Exercise OLYMPIAD/HOTS CORNER|10 VideosDECIMALS
MTG IIT JEE FOUNDATION|Exercise OLYMPIAD/HOTS CORNER|20 Videos
Similar Questions
Explore conceptually related problems
MTG IIT JEE FOUNDATION-DATA HANDLING -Exercise (Subjective Problems (Very Short Answer Type))
- Pictographs
Text Solution
|
- The daily wages of 30 workers (in Rs.) in a factory is given below. ...
Text Solution
|
- The following is a list of size of shoes of 8 students of class VI :5,...
Text Solution
|
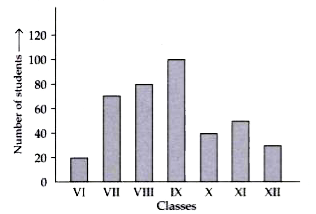
- The following bar graph shows the number of students in different clas...
Text Solution
|
- The bar graph shows the number of toys produced by a factory during a ...
Text Solution
|
- If represents 150 pillars, what does represents ?
Text Solution
|
- The given table shows the number of toffees four friends has How...
Text Solution
|
- Students of a class were tested to find their pulse rate. The followin...
Text Solution
|
- Given below are the marks obtained by 15 students of a class in a test...
Text Solution
|