Home
Class 6
MATHS
Study the bar graph given below and answ...

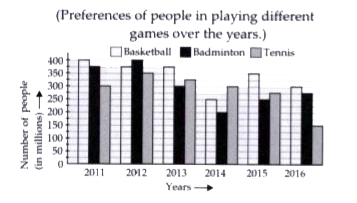
Study the bar graph given below and answer the following questions.

From 2011 to 2016, find the difference between the total number of people who preferred to play Basketball and Badminton (in millions) ?

A

525

B

275

C

730

D

250

Text Solution

Verified by Experts

The correct Answer is:
D
Doubtnut Promotions Banner Mobile Dark
|

Topper's Solved these Questions

  • DATA HANDLING

    MTG IIT JEE FOUNDATION|Exercise Exercise (Subjective Problems (Integer/Numerical Value Type )|10 Videos
  • BASIC GEOMETRICAL IDEAS

    MTG IIT JEE FOUNDATION|Exercise OLYMPIAD/HOTS CORNER|10 Videos
  • DECIMALS

    MTG IIT JEE FOUNDATION|Exercise OLYMPIAD/HOTS CORNER|20 Videos

Similar Questions

Explore conceptually related problems

Study the bar graph and answer the following questions. Which sport is preferred least ?

Study the bar graph and answer the following questions. What is the difference between number of students playing football and hockey ?

Knowledge Check

  • Study the following bar graph and answer the question that follows.

    A
    2014
    B
    2009
    C
    2010
    D
    2012
  • Study the bar diagram and answer the questions. The difference between the total number of bys and the total number of girls from all the Departments together is

    A
    `540`
    B
    `520`
    C
    `460`
    D
    `440`
  • Similar Questions

    Explore conceptually related problems

    Read the bar graph given below and answer the following questions. Find the difference between the production of foodgrains in million tonnes) in the year 2012 and 2015.

    Read the bar graph given below and answer the following questions. What is the ratio of the production of foodgrains in 2011 to that in 2014?

    Study the given graph carefully and answer the following questions. The difference between the number of children who pay tennis and cricket together & basketball and volleyball together is

    Study the bar graph given below and answer the following questions. How many people (in millions) have preferred to play Tennis in all years altogether ?

    Direction :- Study of bar graph and answer the questions. From 2001 to 2006, the total number of people who preferred to play Football I was that (in millions)? (A) 1525 (B) 1620 (C) 1730 (D) 1800

    Bar graph given below shows pens sold by a retailor on five different days. Study the data carefully and answer the following questions. Pen sold on different days Find the difference between total number of pens sold on Monday and Tuesday together to total number of pens sold on Thursday and Friday together?