


Topper's Solved these Questions
INTRODUCTION TO GRAPHS
MTG IIT JEE FOUNDATION|Exercise EXERCISE (SUBJECTIVE PROBLEMS) (VERY SHORT ANSWER TYPE) |1 VideosINTRODUCTION TO GRAPHS
MTG IIT JEE FOUNDATION|Exercise EXERCISE (SUBJECTIVE PROBLEMS) (SHORT ANSWER TYPE) |2 VideosINTRODUCTION TO GRAPHS
MTG IIT JEE FOUNDATION|Exercise EXERCISE (Assertion & Reason Type)|8 VideosFOOTSTEPS TOWARDS JEE MAIN
MTG IIT JEE FOUNDATION|Exercise Section B (Numerical Value Type Questions) |9 VideosLINEAR EQUATIONS IN ONE VARIABLE
MTG IIT JEE FOUNDATION|Exercise Olympiad/HOTS Corner |15 Videos
Similar Questions
Explore conceptually related problems
MTG IIT JEE FOUNDATION-INTRODUCTION TO GRAPHS -EXERCISE (SUBJECTIVE PROBLEMS) ( VERY SHORT ANSWER TYPE)
- Given below is the distance vs time graph d=5t , where d is distance a...
Text Solution
|
- Plot the following points on a graph paper: (3,2)
Text Solution
|
- Plot the following points on a graph paper: (2,2)
Text Solution
|
- Given the ordinate and abscissa for each of the following points: A...
Text Solution
|
- Given the ordinate and abscissa for each of the following points: B...
Text Solution
|
- Given the ordinate and abscissa for each of the following points: C...
Text Solution
|
- Given the ordinate and abscissa for each of the following points: D...
Text Solution
|
- Plot any three points such that x-coordinate of each point is equal...
Text Solution
|
- The following table gives the information regarding the number of per...
Text Solution
|
- Draw the graph of y = 3x +1.
Text Solution
|
- If in a point abscissa is negative and ordinate is positive , then in ...
Text Solution
|
- A stone is dropped off the edge of a cliff. The height (h metres) of t...
Text Solution
|
- A stone is dropped off the edge of a cliff. The height (h metres) of t...
Text Solution
|
- A car is going for a long journey of 16 hours, 4. starting at 5:00 hrs...
Text Solution
|
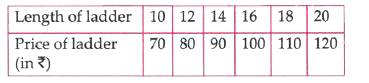
- The prices of different lengths of ladder (in m ) is shown in the foll...
Text Solution
|
- The perimeter P and sides of a square are connected by the relation...
Text Solution
|
- The graph exhibits the rate of interest on fixe deposits upto one year...
Text Solution
|
- From the data given below, draw a linear graph showing the relationshi...
Text Solution
|
- Simple interest on a certain sum is 40 per year. Then, S= 40 xx X, wh...
Text Solution
|