Text Solution
Verified by Experts
The correct Answer is:


Topper's Solved these Questions
INTRODUCTION TO GRAPHS
MTG IIT JEE FOUNDATION|Exercise OLYMPIAD/HOTS CORNER |5 VideosINTRODUCTION TO GRAPHS
MTG IIT JEE FOUNDATION|Exercise EXERCISE (SUBJECTIVE PROBLEMS) (LONG ANSWER TYPE) |5 VideosFOOTSTEPS TOWARDS JEE MAIN
MTG IIT JEE FOUNDATION|Exercise Section B (Numerical Value Type Questions) |9 VideosLINEAR EQUATIONS IN ONE VARIABLE
MTG IIT JEE FOUNDATION|Exercise Olympiad/HOTS Corner |15 Videos
Similar Questions
Explore conceptually related problems
MTG IIT JEE FOUNDATION-INTRODUCTION TO GRAPHS -EXERCISE (INTEGER/NUMERICAL VALUE TYPE)
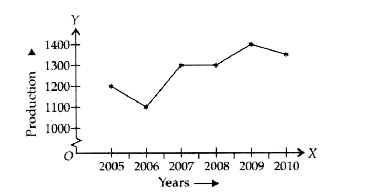
- The percent rise in production in 2007 from 2006 is x %. Find the valu...
Text Solution
|
- The following line-graph gives the annual profit percent earned by a C...
Text Solution
|
- The following line-graph gives the annual profit percent earned by a C...
Text Solution
|
- The following line-graph gives the annual profit percent earned by a C...
Text Solution
|
- The following line-graph gives the annual profit percent earned by a C...
Text Solution
|