A
B
C
D
Text Solution
Verified by Experts
The correct Answer is:


Topper's Solved these Questions
Similar Questions
Explore conceptually related problems
MTG IIT JEE FOUNDATION-SOUND -OLYMPIAD/HOTS CORNER
- Voice of which of the following creatures is likely to have maximum fr...
Text Solution
|
- The thunder of a lightening in the sky is heard 10 seconds after the f...
Text Solution
|
- If one puts ones ears to the steel rail, the sound of a coming train c...
Text Solution
|
- While travelling from air to water path of a sound beam is likely to b...
Text Solution
|
- Loudness of sound is directly proportional to the of the amplitude of ...
Text Solution
|
- When we tighten the string on a guitar, its pitch
Text Solution
|
- In regular vibrations
Text Solution
|
- Loudness of sound increases with
Text Solution
|
- Match the following and select the correct answer from the codes given...
Text Solution
|
- The ultrasonic waves take 4 seconds to travel from the ship to the bot...
Text Solution
|
- The oscilloscope traces for sound waves with different frequencies are...
Text Solution
|
- A car approaches a hill with constant speed. When it is at a distance ...
Text Solution
|
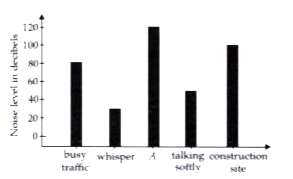
- The graph shown here provides information about noise levels in differ...
Text Solution
|
- The speed of sound in air, water and steel is different. If the speed ...
Text Solution
|
- The intensity of sound wave gets reduced by 10% on passing through a s...
Text Solution
|