The following data on the number of girls to the nearest ton per thousand boys in different sections of the society is given below:
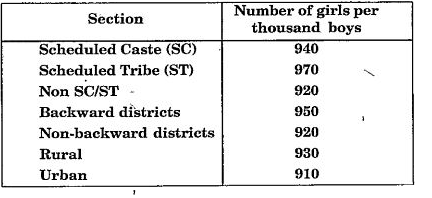
(i) Represent the information above by a bar graph.
(ii) Write two conclusions you can arrive at from the graph, with justification.


