


Topper's Solved these Questions
INTRODUCTION TO GRAPHS
NAND LAL PUBLICATION|Exercise EXERCISE 15.2|8 VideosINTRODUCTION TO GRAPHS
NAND LAL PUBLICATION|Exercise EXERCISE 15.3|5 VideosEXPONENTS AND POWER
NAND LAL PUBLICATION|Exercise SAMPLE PAPER FOR PRACTICE |22 VideosLINEAR EQUATIONS IN ONE VARIABLE
NAND LAL PUBLICATION|Exercise SAMPLE PAPER FOR PRACTICE |21 Videos
Similar Questions
Explore conceptually related problems
NAND LAL PUBLICATION-INTRODUCTION TO GRAPHS -SAMPLE PAPER FOR PRACTICE
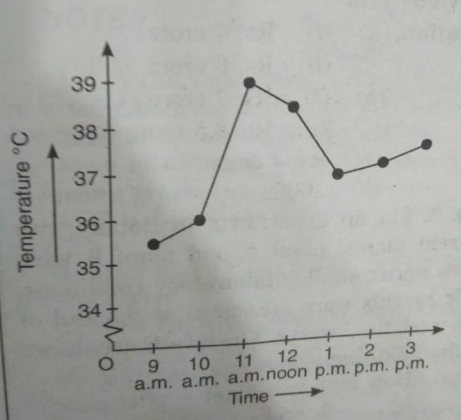
- The following graph shows the tempreature of a patient in a hospital,r...
Text Solution
|
- Fill in the blanks To draw a line graph , the maximum numbe...
Text Solution
|
- The co - or dinates of a point which are 7 units aways from ...
Text Solution
|
- The y- coordinate of a point is distance from x - axis
Text Solution
|
- In a cartesian plane x - coordinate of a points is called .
Text Solution
|
- Correct the following statements . The x- coordinate of a po...
Text Solution
|
- Point (0,2) lies on x - axis .
Text Solution
|
- Graph joining (4,3),(4,7) , (4,1) is perpendicular to y - axi...
Text Solution
|
- X - axis is a vertical line .
Text Solution
|
- Answer the multiple choice questions . The co -ordinate of a...
Text Solution
|
- The point which lies on y - axis is (i) (0,5) (ii) (2,0...
Text Solution
|
- Co - ordinates of the origin are (i) (0,0) (ii) (2,0) ...
Text Solution
|
- The abscissa of the point (2,5) marked on the graph is (i) 5...
Text Solution
|
- Which of the following points lie on axis /y-axis (i) (0,...
Text Solution
|
- Name the axis on which the following points lie (i) (0,9)
Text Solution
|
- Name the axis on which the following points lie (12,0)
Text Solution
|
- Name the axis on which the following points lie (0,6)
Text Solution
|
- Name the axis on which the following points lie (7,0)
Text Solution
|
- Write the distances of these points from y- axis . (4,2)
Text Solution
|
- Write the distances of these points from y- axis . (1,5)
Text Solution
|
- Write the distances of these points from y- axis . (0,7)
Text Solution
|