


Topper's Solved these Questions
INTRODUCTION TO GRAPHS
NAND LAL PUBLICATION|Exercise ADDITIONAL QUESTIONS FOR PRACTICE (Objective Type Questions)|21 VideosINTRODUCTION TO GRAPHS
NAND LAL PUBLICATION|Exercise ADDITIONAL QUESTIONS FOR PRACTICE (Short Answer Type Questions )|14 VideosINTRODUCTION TO GRAPHS
NAND LAL PUBLICATION|Exercise EXERCISE 15.2|8 VideosEXPONENTS AND POWER
NAND LAL PUBLICATION|Exercise SAMPLE PAPER FOR PRACTICE |22 VideosLINEAR EQUATIONS IN ONE VARIABLE
NAND LAL PUBLICATION|Exercise SAMPLE PAPER FOR PRACTICE |21 Videos
Similar Questions
Explore conceptually related problems
NAND LAL PUBLICATION-INTRODUCTION TO GRAPHS -EXERCISE 15.3
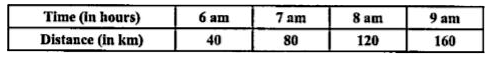
- Draw the graphs for the following tables of values , with sui...
Text Solution
|
- Draw the graphs for the following tables of values , with sui...
Text Solution
|
- Interest on deposits for a year (i) Does the graph pass ...
Text Solution
|
- Draw a graph for the following . Is it a linear grap...
Text Solution
|
- Draw a graph for the following . Is it a linear graph...
Text Solution
|