


Topper's Solved these Questions
INTRODUCTION TO GRAPHS
NAND LAL PUBLICATION|Exercise ADDITIONAL QUESTIONS FOR PRACTICE (Long Answer Type Questions )|3 VideosINTRODUCTION TO GRAPHS
NAND LAL PUBLICATION|Exercise ADDITIONAL QUESTIONS FOR PRACTICE (HOTS )|1 VideosINTRODUCTION TO GRAPHS
NAND LAL PUBLICATION|Exercise ADDITIONAL QUESTIONS FOR PRACTICE (Objective Type Questions)|21 VideosEXPONENTS AND POWER
NAND LAL PUBLICATION|Exercise SAMPLE PAPER FOR PRACTICE |22 VideosLINEAR EQUATIONS IN ONE VARIABLE
NAND LAL PUBLICATION|Exercise SAMPLE PAPER FOR PRACTICE |21 Videos
Similar Questions
Explore conceptually related problems
NAND LAL PUBLICATION-INTRODUCTION TO GRAPHS -ADDITIONAL QUESTIONS FOR PRACTICE (Short Answer Type Questions )
- Write the following points whose abscissa is 4 ordinate is 0
Text Solution
|
- Write the following points whose abscissa is 1 Ordinate is 5
Text Solution
|
- Write the following points whose ordinate is 7 absicssa is 3
Text Solution
|
- What are the co - ordinaes of the Origin
Text Solution
|
- A point on x - axis at a distance x from the origin .
Text Solution
|
- A point on y axis at a distance y from the origin.
Text Solution
|
- Plot the points P ( P,7(,Q(5,5)R(5,0) and S (1,0) on the cartesia...
Text Solution
|
- Name of the line segment parallel to y- axis
Text Solution
|
- Plot a rectangle which lies in the first quarant , has origin ...
Text Solution
|
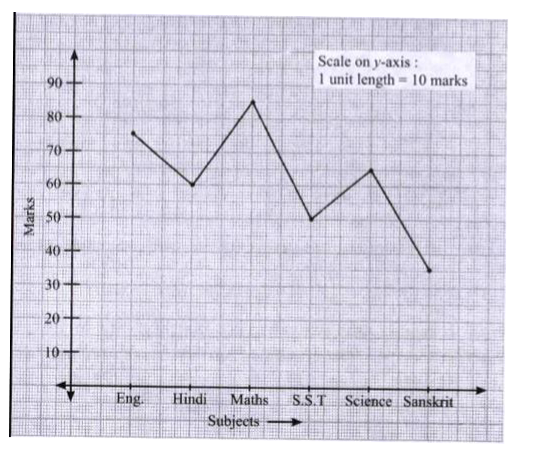
- Marks obtained by a student in six diferent subjects is depic...
Text Solution
|
- Marks obtained by a student in six diferent subjects is depic...
Text Solution
|
- Marks obtained by a student in six diferent subjects is depic...
Text Solution
|
- Marks obtained by a student in six diferent subjects is depic...
Text Solution
|
- Marks obtained by a student in six diferent subjects is depic...
Text Solution
|