 .
.


Topper's Solved these Questions
MENSURATION
SWAN PUBLICATION|Exercise Think, Discuss And Write |9 VideosMENSURATION
SWAN PUBLICATION|Exercise Exercise 11.1 |4 VideosMENSURATION
SWAN PUBLICATION|Exercise Try These |23 VideosLINEAR EQUATIONS IN ONE VARIABLE
SWAN PUBLICATION|Exercise EXERCISE 2.6|14 VideosPLAYING WITH NUMBERS
SWAN PUBLICATION|Exercise Exercise 2|4 Videos
Similar Questions
Explore conceptually related problems
SWAN PUBLICATION-MENSURATION-DO THIS
- Draw any trapezium WXYZ on a piece of graph paper as shown in the fig....
Text Solution
|
- Find the mid point of XY by folding the side and name it A. (see adjoi...
Text Solution
|
- Cut trapezium WXYZ into two pieces by cutting along ZA. Place DeltaZYA...
Text Solution
|
- The area of this triangle and the area of the trapezium WXYZ are same ...
Text Solution
|
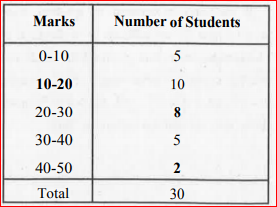
- For the following data, draw a frequency polygon .
Text Solution
|
- Arrange 64 cubes of equal size in as many ways as you can to form a cu...
Text Solution
|