Consider the following distribution of daily wages of 50 workers of a factory. Find the mean daily wages of the workers of the factory by using an appropriate method.
find the mean of daily wages of 60 workers in a factory as per data given below:
Find the mean salary of 60 workers of a factory from the following table :
The following table gives the distribution of total household expenditure (in Rs) of mannual workers in a city. Find the mean expenditure (in Rs) per household by using on approximate method. What does mean signify?
In the fig. there is a histogram depicting daily wages of workers in a factory. Construct the frequency distribution table
Study the following Frequency distribution table and answer the question given below. Frequency Distrubution of Daily Income of 550 workers of a factory " " Table (i) What is the size of the class intervals? (ii) Which class has the highest frequency? (iii) Which class the lowest frequency? (iv) Which two classes have the same frequency?
Find the mean of the following data using deviation method :
Find the mean of the following data using deviation method :
The following distribution shows the daily pocket allowance of children of a locality. The mean pocket allowance is rs18. Find the missing frequency f.
The daily wages of 50 workers in a factory are given below: Construct a histogram to represent the above frequency distribution.
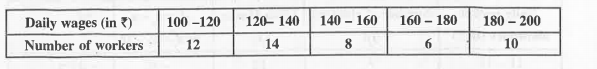 Find the mean daily wages of the workers of the factory by using an appropriate method.

