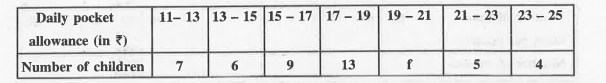
The following distribution shows the daily pocket allowance of children of a locality. The mean pocket allowance is rs18. Find the missing frequency f.
If the mean of the following data is 20.6. Find the missing frequency (x).
If the mean of the following frequency distribution is 188. Find the missing frequencies f_1 x and f_2
The mean of the following frequency distributions is 1.46 Find the missing frequencies.
The mean of the following distribution is 50 find the value of a and hence frequencies of 30 and 70.
The following frequency distribution gives the monthly consumption of electricity of 68 consumers of a locality. Find the median, mean and mode of the data and compare them.
Consider the following distribution of daily wages of 50 workers of a factory. Find the mean daily wages of the workers of the factory by using an appropriate method.
The mean of the following distribution is 50 Find the value of a and hence the frequencies of 30 and 70.
The following table shows the distribution of salaries of a group of workers : Determine cumulative frequencies Draw the cumulative frequency curve i.e. less than ogive on a graph paper. From graphs, write down the median salary (in Rs)?
The table below shows the daily expenditure on food of 25 households in a locality. Find the mean daily expenditure on food by a suitable method.
If the mean of the following frequency distribution is 8, find the value of p