The following table gives the distribution of total household expenditure (in Rs) of mannual workers in a city. Find the mean expenditure (in Rs) per household by using on approximate method. What does mean signify?
The following data gives the distribution of total monthly household expenditure of 200 families of a village. Find the modal monthly expenditure of the families. Also, find the mean monthly expenditure :
The following table shows the daily production of T.V sets in a industry for 7 days of a week Represent the above information by bar graph.
A survey was conducted by a groupofstudentsas a part of their enviromentawareness programme, in which they collected the following data regarding the number of plants in 20 houses in a locality. Find the mean number of plants per house. Which method did you use for finding the mean, and why?
Consider the following distribution of daily wages of 50 workers of a factory. Find the mean daily wages of the workers of the factory by using an appropriate method.
The following table gives the distribution of different families on education. Find mean expenditure on education of a family.
Form the pair of linear equations in the following problems and find their solutions (if they exist) by any algebraic method :- The total expenditure per month of a household consists of a fixed rent of the house and mess charges depending upon the number of people sharing the house. The total monthly expenditure is ? 3900 for 2 people and 7500 for 5 people. Find the rent of the house and mess charges per head per month.
The table below gives the expenditure of distribution of female teachers in the primary schools of rural areas of various states and U.T. of India. Find the mean percentage of female teachers by step deviation method.
The following distribution shows the daily pocket allowance of children of a locality. The mean pocket allowance is rs18. Find the missing frequency f.
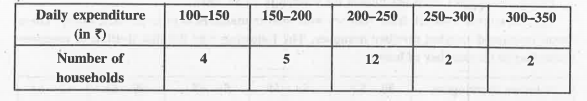 Find the mean daily expenditure on food by a suitable method.

