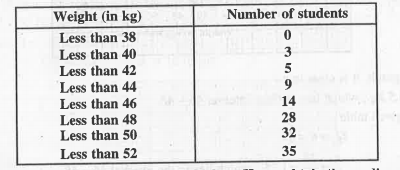
During the medial check up of 35 students of a class, their weights were recorded as follows: Draw a less than type ogive for the given data. Hence obtain the median weight from the graph and verify the result by using the formula.
Height of 50 plants in a garden were recorded and data is presented as below: Draw ‘less than’ ogive and ‘more than’ ogive simultaneously on the same graph and find the median of the data from graph. Also verify your result by using formula.
In a particular section of Class IX, 40 students were asked about the months of their birth and the following graph was prepared for the data so obtained: Observe the bar graph given above and answer the following questions: (i) How many students were born in the month of November? (ii) In which month were the maximum number of students born?
The number of hours for which students of a particular class watched telecvision during holidays is shown through the given graph.Answer the following. How many students watched TV for less than 4 hours ?
A company manufactures carbatteries of particular type. The lives (in years) of 40 such batteries were recorded as follows : Construct a grouped frequency distribution table for this data, using class intervals of size 0.5 starting from the interval 2— 2.5.
The number of hours for which students of a particular class watched television during holidays is shown through the given graph. Answer the following: (i) For how many hours did the maximum number of students watch TV? (ii) How many students watched TV for less than 4 hours? (iii) How many students spent more than 5 hours in watching TV?
Two hundred students of 6th and 7th classes were asked to name their favourite colour so as to decide upon what should be the colour of their school building. The results are shown in the following table. Represent the given data on a bar graph. Answer the following questions with the help of the bar graph: How many colours are there in all? What are they?
Two hundred students of 6th and 7th classes were asked to name their favourite colour so as to decide upon what should be the colour of their school building. The results are shown in the following table. Represent the given data on a bar graph. Answer the following questions with the help of the bar graph: Which is the most preferred colour and which is the least preferred?
The following table shows the distribution of salaries of a group of workers : Determine cumulative frequencies Draw the cumulative frequency curve i.e. less than ogive on a graph paper. From graphs, write down the median salary (in Rs)?