A
B
C
D
Text Solution
Verified by Experts
The correct Answer is:


Topper's Solved these Questions
STATES OF MATTER
BRILLIANT PUBLICATION|Exercise LEVEL III (Numerical Type)|7 VideosSTATES OF MATTER
BRILLIANT PUBLICATION|Exercise LEVEL III (Matching Column Type .)|7 VideosSTATES OF MATTER
BRILLIANT PUBLICATION|Exercise LEVEL III (Single Correct Answer Type)|10 VideosSOME BASIC CONCEPTS OF CHEMISTRY
BRILLIANT PUBLICATION|Exercise LEVEL-I|55 VideosSTRUCTURE OF ATOMS
BRILLIANT PUBLICATION|Exercise LEVEL - III (Linked Comprehension Type)|8 Videos
Similar Questions
Explore conceptually related problems
BRILLIANT PUBLICATION-STATES OF MATTER -LEVEL III (Multiple Correct Answer type )
- Which of the following changes decrease the vapour pressure of water k...
Text Solution
|
- If the rms velocities of nitrogen and oxygen molecules are same at two...
Text Solution
|
- Which of the following is/are true?
Text Solution
|
- According to kinetic theory of gases
Text Solution
|
- Which of the following facts regarding mean free path of gaseous molec...
Text Solution
|
- Two flasks A and B have equal volumes. Flask A contains hydrogen at 30...
Text Solution
|
- Which of the following facts stated along with the given characteristi...
Text Solution
|
- Which of the following statements are not correct?
Text Solution
|
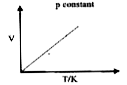
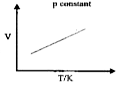
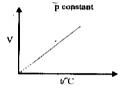
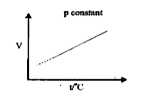
- Which of the following graphs represent the behaviour of an ideal gas ...
Text Solution
|
- Let u(av), u(rms )and u(mp) respectively denote the average speed, roo...
Text Solution
|
- Point A in the given curve shifts to higher value of velocity if
Text Solution
|
- Precisely I'mole of helium and 1 mol of neon are placed in a container...
Text Solution
|
- Which of the following pair of gases will have same rate of diffusion ...
Text Solution
|
- Which of the following statements is/are correct about real gases?
Text Solution
|