A
B
C
D
लिखित उत्तर
Verified by Experts
The correct Answer is:


Recommended Questions
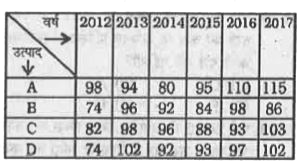
- दी गई तालिका 6 वर्षो में चार उत्पादों A,B,C और D की बिक्री से किसी कंप...
Text Solution
|
- यह ज्ञात है की महाविद्यालय के छात्रों में से 60 % छात्रावास में रहते ...
Text Solution
|
- The following line diagram represents the yearly sales figure of a com...
Text Solution
|
- The following line diagram represents the yearly sales figure of a com...
Text Solution
|
- The given pie chart shows the quantity wise sales distribution of five...
Text Solution
|
- The table shows the production of different types of cars (in thousand...
Text Solution
|
- The given Bar Graph presents Income and Expenditure (in crores of Rupe...
Text Solution
|
- The pie-chart specifically shows the allocation of revenue for the exp...
Text Solution
|
- The given table represents the revenue (in ₹ crores) of a company from...
Text Solution
|