A
B
C
D
लिखित उत्तर
Verified by Experts
The correct Answer is:


Recommended Questions
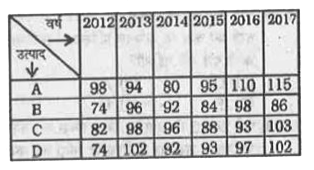
- दी गई तालिका 6 वर्षो में चार उत्पादों A,B,C और D की बिक्री से किसी कंप...
Text Solution
|
- The table below shows the sales of milk in six different states as a p...
Text Solution
|
- The table below shows the sales of milk in six different states as a p...
Text Solution
|
- The table below shows the sales of milk in six different states as a p...
Text Solution
|
- The table below shows the sales of milk in six different states as a p...
Text Solution
|
- The following line diagram represents the yearly sales figure of a com...
Text Solution
|
- The following line diagram represents the yearly sales figure of a com...
Text Solution
|
- The given pie chart shows the quantity wise sales distribution of five...
Text Solution
|
- The table shows the production of different types of cars (in thousand...
Text Solution
|