A
B
C
D
लिखित उत्तर
Verified by Experts
The correct Answer is:


Recommended Questions
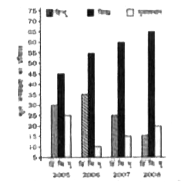
- निम्न आरेख 2005 से 2008 के दौरान एक नगर में कुल जनसंख्या की तुलना में ...
Text Solution
|
- चित्र में दिया गया वृत्त चार्ट मई -जून 2013 के दौरान वाहनों का केन्...
Text Solution
|
- चित्र में दिया गया वृत्त चार्ट मई -जून 2013 के दौरान वाहनों का केन्...
Text Solution
|
- The population of a town is 3,11,250. The ratio between women and men ...
Text Solution
|
- The following line diagram represents the yearly sales figure of a com...
Text Solution
|
- The population of a town has increased by 5% at the end of the first y...
Text Solution
|
- The given pie chart shows the quantity wise sales distribution of five...
Text Solution
|
- In the given bar graph, the percentage decrease in the number of stude...
Text Solution
|
- In the given bar graph, the Blue bar shows the income and the Red bar ...
Text Solution
|