A
B
C
D
लिखित उत्तर
Verified by Experts
The correct Answer is:


Recommended Questions
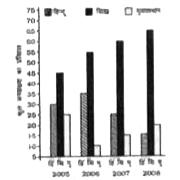
- निम्न आरेख 2005 से 2008 के दौरान एक नगर में कुल जनसंख्या की तुलना में ...
Text Solution
|
- Match the following Column A to Column B
Text Solution
|
- निम्नलिखित प्रश्नों के उत्तर दीजिए: 'गिन्नी का सोना' पाठ में शुद्ध आदर...
Text Solution
|
- The following line diagram represents the yearly sales figure of a com...
Text Solution
|
- The following line diagram represents the yearly sales figure of a com...
Text Solution
|
- छात्र की मौखिक अभिव्यक्ति की योग्यता का मूल्यांकन करते समय निम्न में स...
Text Solution
|
- In the given bar graph, the percentage decrease in the number of stude...
Text Solution
|
- In the given bar graph, the Blue bar shows the income and the Red bar ...
Text Solution
|
- The given pie chart represents the popularity of ice-cream flavours in...
Text Solution
|