A
B
C
D
लिखित उत्तर
Verified by Experts
The correct Answer is:


Recommended Questions
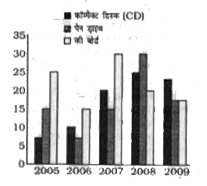
- निम्नलिखित ग्राफ का अध्ययन कीजिए,जिसमे विभिन्न मदों का उत्पादन (हजार म...
Text Solution
|
- चित्र में दिया गया वृत्त चार्ट मई -जून 2013 के दौरान वाहनों का केन्...
Text Solution
|
- चित्र में दिया गया वृत्त चार्ट मई -जून 2013 के दौरान वाहनों का केन्...
Text Solution
|
- Study the following pie chart and table to answer the question.Total n...
Text Solution
|
- Study the following graph which shows the production (in thousand) of ...
Text Solution
|
- The given Bar Graph presents the number of students of two schools for...
Text Solution
|
- The Table shows the Number of Laptops and Desktops manufactured by a c...
Text Solution
|
- Study the chart and answer the questions: In which of the given year...
Text Solution
|
- Study the following graph which shows income and expenditure of a comp...
Text Solution
|