A
B
C
D
लिखित उत्तर
Verified by Experts
The correct Answer is:


Recommended Questions
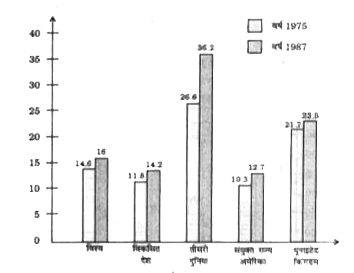
- निम्नलिखित बार-ग्राफ का अध्ययन करे। बार-ग्राफ में वर्ष 1975 से 1987 त...
Text Solution
|
- यह ज्ञात है की महाविद्यालय के छात्रों में से 60 % छात्रावास में रहते ...
Text Solution
|
- The given bar graph shows the sale of books (in thousands) in four met...
Text Solution
|
- In the following table, the production of various crops (in tonnes) is...
Text Solution
|
- Study the chart and answer the questions: In which of the given year...
Text Solution
|
- The given Bar Graph presents the number of students of two schools for...
Text Solution
|
- The given Bar Graph presents the number of students of two schools for...
Text Solution
|
- The following figure shows the number of students (in thousands) admit...
Text Solution
|
- The following figure shows the number of students (in thousands) admit...
Text Solution
|