A
B
C
D
लिखित उत्तर
Verified by Experts
The correct Answer is:


Recommended Questions
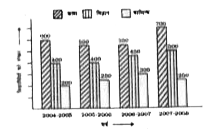
- निम्नलिखित बार ग्राफ में वर्ष 2004-2005 से 2007-2008 तक के सत्र में कि...
Text Solution
|
- यह ज्ञात है की महाविद्यालय के छात्रों में से 60 % छात्रावास में रहते ...
Text Solution
|
- The following line diagram represents the yearly sales figure of a com...
Text Solution
|
- The following line diagram represents the yearly sales figure of a com...
Text Solution
|
- The following line diagram represents the yearly sales figure of a com...
Text Solution
|
- The following line diagram represents the yearly sales figure of a com...
Text Solution
|
- Study the chart and answer the questions: In which of the given year...
Text Solution
|
- The given Bar Graph presents the number of students of two schools for...
Text Solution
|
- The given Bar Graph presents the number of students of two schools for...
Text Solution
|