A
B
C
D
लिखित उत्तर
Verified by Experts
The correct Answer is:


Recommended Questions
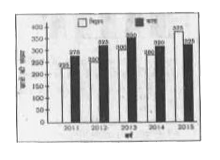
- दिया गया दंड आरेख (बार ग्राफ) विभिन्न वर्षो में एक स्कूल के विज्ञान और...
Text Solution
|
- चित्र में दिया गया वृत्त चार्ट मई -जून 2013 के दौरान वाहनों का केन्...
Text Solution
|
- चित्र में दिया गया वृत्त चार्ट मई -जून 2013 के दौरान वाहनों का केन्...
Text Solution
|
- Study the following pie chart and table to answer the question.Total n...
Text Solution
|
- विद्यार्थियों की एक पंक्ति में , सोहन का स्थान दोनों मे से किसी भी किन...
Text Solution
|
- The given bar graph presents the number of different types of vehicles...
Text Solution
|
- The given bar graph presents the number of students from Science and A...
Text Solution
|
- In the given bar graph, the percentage decrease in the number of stude...
Text Solution
|
- The table given below presents the number of books on different subjec...
Text Solution
|