A
B
C
D
लिखित उत्तर
Verified by Experts
The correct Answer is:


Recommended Questions
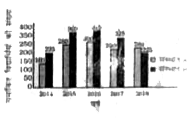
- दिया गया दंड आरेख (बार ग्राफ ) पाँच वर्ष की अवधि के दौरान संस्थान A और...
Text Solution
|
- चित्र में दिया गया वृत्त चार्ट मई -जून 2013 के दौरान वाहनों का केन्...
Text Solution
|
- चित्र में दिया गया वृत्त चार्ट मई -जून 2013 के दौरान वाहनों का केन्...
Text Solution
|
- The given Bar Graph presents the number of students enrolled for a voc...
Text Solution
|
- The given Bar Graph presents the number of students of two schools for...
Text Solution
|
- The given Bar Graph presents the number of students of two schools for...
Text Solution
|
- The given Bar Graph presents the number of students of two schools for...
Text Solution
|
- In the given bar graph, the percentage decrease in the number of stude...
Text Solution
|
- The given Bar Graph presents the number of different types of vehicles...
Text Solution
|