A
B
C
D
लिखित उत्तर
Verified by Experts
The correct Answer is:


Recommended Questions
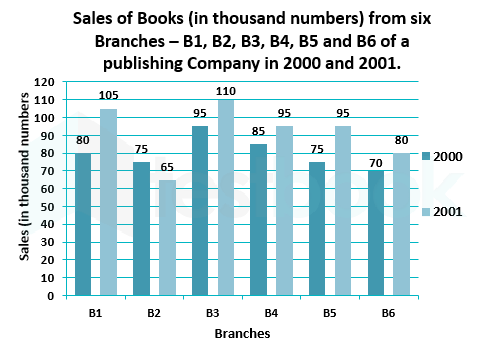
- दिया गया बार ग्राफ एक प्रकाशन कंपनी के दो लगातार वर्षों 2000 तथा 2001 ...
Text Solution
|
- निचे दिये गये ग्राफ में दो प्रकार के वाहनों A व B के छ वर्षो के प्रद...
Text Solution
|
- चित्र में दिया गया वृत्त चार्ट मई -जून 2013 के दौरान वाहनों का केन्...
Text Solution
|
- निचे दिये गये ग्राफ में दो प्रकार के वाहनों A व B के छ वर्षो के प्रद...
Text Solution
|
- चित्र में दिया गया वृत्त चार्ट मई -जून 2013 के दौरान वाहनों का केन्...
Text Solution
|
- The following line diagram represents the yearly sales figure of a com...
Text Solution
|
- The following line diagram represents the yearly sales figure of a com...
Text Solution
|
- The table shows the production of different types of cars (in thousand...
Text Solution
|
- Table shows the sales of books (in thousands) from six branches of a p...
Text Solution
|