A
B
C
D
लिखित उत्तर
Verified by Experts
The correct Answer is:


Recommended Questions
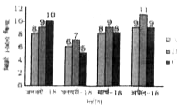
- दिया गया दंड आरेख (बार ग्राफ ) तीन विक्रय केंद्रों A, B और C के द्वारा...
Text Solution
|
- The following line diagram represents the yearly sales figure of a com...
Text Solution
|
- The given Bar Graph presents the Target and Actual production of AC Ma...
Text Solution
|
- The given Bar Graph presents the sale (in 1000 kg) of a particular bra...
Text Solution
|
- The given Bar Graph presents the sale (in 1000 kg) of a particular bra...
Text Solution
|
- The given Bar Graph presents the sale (in 1000 kg) of a particular bra...
Text Solution
|
- The given Bar Graph presents Income and Expenditure (in crores of Rupe...
Text Solution
|
- The given Bar Graph presents Income and Expenditure (in crores of Rupe...
Text Solution
|
- The given bar graph presents the results in terms of number of student...
Text Solution
|