A
B
C
D
लिखित उत्तर
Verified by Experts
The correct Answer is:


Recommended Questions
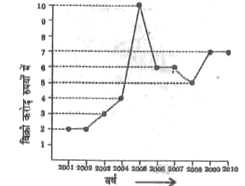
- निम्नलिखित रेखा आरेख किसी कंपनी की वर्ष 2001-2010 के दौरान वार्षिक बिक...
Text Solution
|
- The following line diagram represents the yearly sales figure of a com...
Text Solution
|
- The following line diagram represents the yearly sales figure of a com...
Text Solution
|
- The following line diagram represents the yearly sales figure of a com...
Text Solution
|
- The following line diagram represents the yearly sales figure of a com...
Text Solution
|
- The following line diagram represents the yearly sales figure of a com...
Text Solution
|
- The given bar chart shows the details of cycle sales by a company betw...
Text Solution
|
- The given Bar Graph presents the sales of the number of books (in thou...
Text Solution
|
- The following graph shows the sales of cars (in thousands) in four cit...
Text Solution
|