A
B
C
D
लिखित उत्तर
Verified by Experts
The correct Answer is:


Recommended Questions
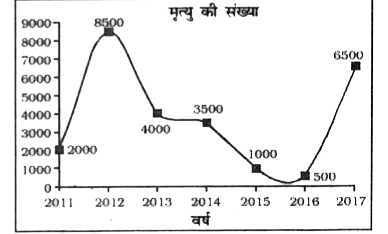
- यह रेखा ग्राफ एक विशिष्ट राज्य में रेल दुर्घटनाओं के कारण होने वाली मौ...
Text Solution
|
- Match the following Column A to Column B
Text Solution
|
- चित्र में दिया गया वृत्त चार्ट मई -जून 2013 के दौरान वाहनों का केन्...
Text Solution
|
- चित्र में दिया गया वृत्त चार्ट मई -जून 2013 के दौरान वाहनों का केन्...
Text Solution
|
- निम्नलिखित प्रश्नों के उत्तर दीजिए: 'गिन्नी का सोना' पाठ में शुद्ध आदर...
Text Solution
|
- The following line diagram represents the yearly sales figure of a com...
Text Solution
|
- The following line diagram represents the yearly sales figure of a com...
Text Solution
|
- The following graph shows the number of boys and girls in class V, cla...
Text Solution
|
- In the given bar graph, the Blue bar shows the income and the Red bar ...
Text Solution
|