A
B
C
D
लिखित उत्तर
Verified by Experts
The correct Answer is:


Recommended Questions
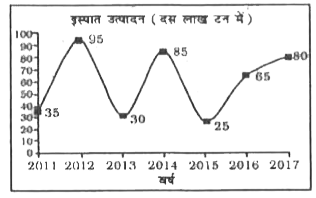
- यह रेखा ग्राफ एक विशिष्ट देश के इस्पात के उत्पादन को दर्शाता है। इस आर...
Text Solution
|
- Match the following Column A to Column B
Text Solution
|
- The following line diagram represents the yearly sales figure of a com...
Text Solution
|
- The following line diagram represents the yearly sales figure of a com...
Text Solution
|
- The following line diagram represents the yearly sales figure of a com...
Text Solution
|
- The following line diagram represents the yearly sales figure of a com...
Text Solution
|
- In the following table, the production of various crops (in tonnes) is...
Text Solution
|
- The graph represents the salary, expenditure, tax and savings (in rupe...
Text Solution
|
- The above graph represents the salary, expenditure, tax and savings (i...
Text Solution
|