A
B
C
D
लिखित उत्तर
Verified by Experts
The correct Answer is:


Recommended Questions
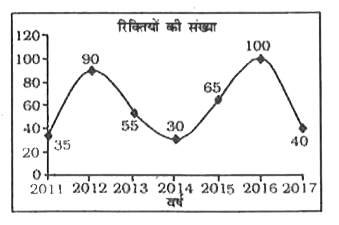
- यह रेखा ग्राफ एक विशिष्ट कंपनी के कार्यकारी अधिकारियों के लिए रिक्तियो...
Text Solution
|
- Match the following Column A to Column B
Text Solution
|
- The following line diagram represents the yearly sales figure of a com...
Text Solution
|
- The following line diagram represents the yearly sales figure of a com...
Text Solution
|
- The following line diagram represents the yearly sales figure of a com...
Text Solution
|
- The following line diagram represents the yearly sales figure of a com...
Text Solution
|
- The following line diagram represents the yearly sales figure of a com...
Text Solution
|
- If the difference between 62% and 80% of a number is 198, then the dif...
Text Solution
|
- The given table represents the number of engineers recruited by four c...
Text Solution
|