A
B
C
D
लिखित उत्तर
Verified by Experts
The correct Answer is:


Recommended Questions
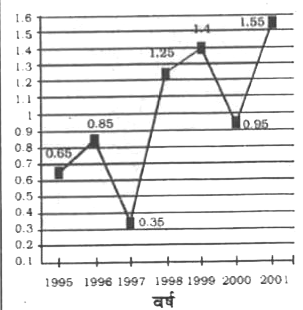
- निम्नलिखित रेखीय ग्राफ 1995 से 2001 की अवधि में किसी कंपनी द्वारा आयात...
Text Solution
|
- The given bar graph shows the imports and exports (in Rs crores) of st...
Text Solution
|
- The following bar graph shows the quantity (in million) of grains expo...
Text Solution
|
- The given Bar Graph presents the number of different types of vehicles...
Text Solution
|
- The following bar graph shows the amount of imports (in million kg) of...
Text Solution
|
- The given Bar Graph presents the Imports and Exports of an items (in t...
Text Solution
|
- The given Bar Graph presents the Imports and Exports of an item (in to...
Text Solution
|
- The given Bar Graph present the Imports and Exports of an item (in ton...
Text Solution
|
- The given Bar Graph present the Imports and Exports of an item (in ton...
Text Solution
|