A
B
C
D
लिखित उत्तर
Verified by Experts
The correct Answer is:


Recommended Questions
- दिए गए पाई-चार्ट में वर्ष 2016 में एक कंपनी के पाँच उत्पादों (A,B,C ,...
Text Solution
|
- यह ज्ञात है की महाविद्यालय के छात्रों में से 60 % छात्रावास में रहते ...
Text Solution
|
- The following line diagram represents the yearly sales figure of a com...
Text Solution
|
- The following line diagram represents the yearly sales figure of a com...
Text Solution
|
- The population of a town has increased by 5% at the end of the first y...
Text Solution
|
- Salary of A increased by 8% in the year 2015 as compared to 2014 and d...
Text Solution
|
- The given bar graph shows the number of marks scored by a student in e...
Text Solution
|
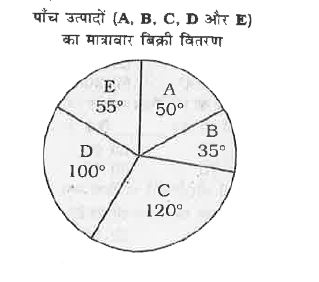
- The given pie chart shows the quantity wise sales distribution of five...
Text Solution
|
- The given pie chart shows the quantity wise sales distribution of five...
Text Solution
|