A
B
C
D
लिखित उत्तर
Verified by Experts
The correct Answer is:


Recommended Questions
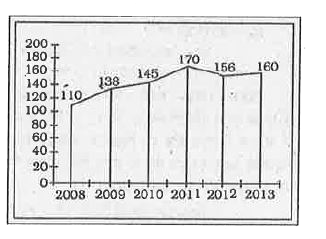
- निम्न रेखा ग्राफ में एक स्कूल में वर्ष 2008 से 2013 तक के वर्षो में उच...
Text Solution
|
- यह ज्ञात है की महाविद्यालय के छात्रों में से 60 % छात्रावास में रहते ...
Text Solution
|
- यौवनारंभ में होने वाले परिवर्तन
Text Solution
|
- The given bar graph shows the number of marks scored by a student in e...
Text Solution
|
- The given Bar Graph presents the number of students of two schools for...
Text Solution
|
- नेत्र में होने वाले दोषों का DISCUSSION
Text Solution
|
- The given bar graph presents the results in terms of number of student...
Text Solution
|
- The given Bar Graph presents the number of students of two schools for...
Text Solution
|
- The given Bar Graph presents the number of students of two schools for...
Text Solution
|